
Page 15 - NBIZ Magazine February 2024
P. 15
The National Establishment Time Series (NETS) docu-
ments the number of businesses moving between states,
including to and from Texas, the employment impacts
of this business migration, and the distribution of those
movers among urban, suburban, and rural areas of the
state. 1
From 2000 to 2019, the number of establishments
moving into Texas annually exceeded the number of
establishments leaving the state (Chart 1).
The story changes slightly when examining net job
migration attributable to business relocations as a share of
overall employment. Texas remains high but sixth nation-
ally, trailing South Dakota, Georgia, Nevada, Arizona, and
Florida. California ranks sixth from the bottom, with the
District of Columbia exporting the most jobs as a share
of overall employment, followed by Delaware, Alaska,
Kansas, Oklahoma, and Vermont.
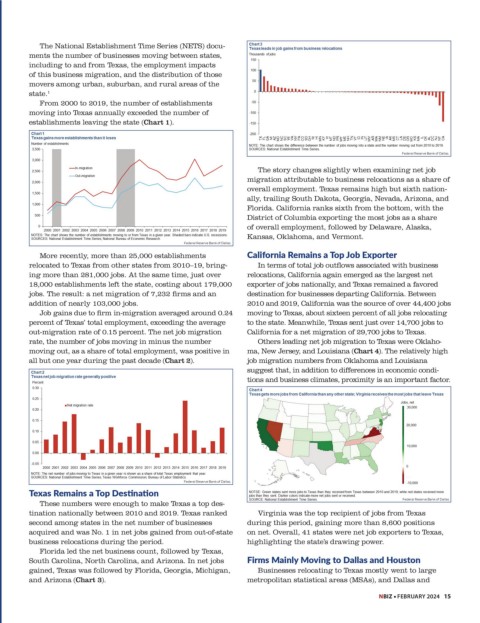
More recently, more than 25,000 establishments California Remains a Top Job Exporter
relocated to Texas from other states from 2010–19, bring- In terms of total job outflows associated with business
ing more than 281,000 jobs. At the same time, just over relocations, California again emerged as the largest net
18,000 establishments left the state, costing about 179,000 exporter of jobs nationally, and Texas remained a favored
jobs. The result: a net migration of 7,232 firms and an destination for businesses departing California. Between
addition of nearly 103,000 jobs. 2010 and 2019, California was the source of over 44,400 jobs
Job gains due to firm in-migration averaged around 0.24 moving to Texas, about sixteen percent of all jobs relocating
percent of Texas’ total employment, exceeding the average to the state. Meanwhile, Texas sent just over 14,700 jobs to
out-migration rate of 0.15 percent. The net job migration California for a net migration of 29,700 jobs to Texas.
rate, the number of jobs moving in minus the number Others leading net job migration to Texas were Oklaho-
moving out, as a share of total employment, was positive in ma, New Jersey, and Louisiana (Chart 4). The relatively high
all but one year during the past decade (Chart 2). job migration numbers from Oklahoma and Louisiana
suggest that, in addition to differences in economic condi-
tions and business climates, proximity is an important factor.
Texas Remains a Top Destination
These numbers were enough to make Texas a top des-
tination nationally between 2010 and 2019. Texas ranked Virginia was the top recipient of jobs from Texas
second among states in the net number of businesses during this period, gaining more than 8,600 positions
acquired and was No. 1 in net jobs gained from out-of-state on net. Overall, 41 states were net job exporters to Texas,
business relocations during the period. highlighting the state’s drawing power.
Florida led the net business count, followed by Texas,
South Carolina, North Carolina, and Arizona. In net jobs Firms Mainly Moving to Dallas and Houston
gained, Texas was followed by Florida, Georgia, Michigan, Businesses relocating to Texas mostly went to large
and Arizona (Chart 3). metropolitan statistical areas (MSAs), and Dallas and
NBIZ ■ FEBRUARY 2024 15